Most of my computer programs I developed and use for research are available in an open-source domain GitHub. Note that not all computer codes are in the open source domain, particularly those I’m actively working thus not ready for publication yet.
The list of programs explained in this page is as below:
| Names (with anchor links) | Important Features | Links |
|---|---|---|
| DiffStress | Stress analysis \applicable to X-Ray, Neutron, CP | Link to Github page |
| VPSC-FLD-YLD | FLD and yield functions using VPSC | Only private access |
| Texture | Python script for crystallographic texture analysis. | link to Github Page |
DiffStress
DiffStress is a Python-based diffraction analysis tool that analyzes the tensorial stress state present on a polycrystal sample. The stress analysis utilizes a set of lattice-spacings (interatomic spacings) obtained from a polycrystalline specimen using a diffractometer (either X-ray or neutron)
This python package allows one to analyze both experimental diffraction lattice strains (d-spacing) and model-emulated lattice strains (internal elastic strain), e.g., those data resulting from EVPSC simulations.
For the purpose of experimental d-spacing analysis, it accepts the format of Proto data. Current software can generate various graphics for the purpose of data visualization by using matplotlib and some in-house scripts written for matplotlib, which is also available under current GitHub account (find “mpl-lib”).
In order to estimate the experimental/model-predicted stress, current software requires the use of diffraction elastic constants written in the format of ‘sff’, which is used in the ‘PF’ software managed by Thomas Gnaeupel-Herold in NCNR, NIST. One may find the template of the ‘sff’ file from the current software package.
Also, given set of diffraction data (say, from EVPSC code), one can perturb the lattice strains in order to quantify the uncertainty in the obtained stress by conducting Monte Carlo virtual experiments.
Application
- Stress analysis from d-spacings
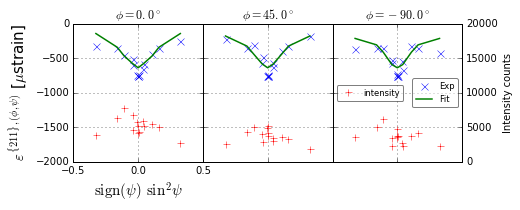
DiffStress can analyze the d-spacings collected in the form of Proto X-ray system. One can obtain a fitting result in various orientation and nicely illustrate the goodness of fit. Below is an example of an interstitial-free steel, that shows the undulation in d-spacing vs. sin2psi curve. With using experimental DECs obtained at various orientation, one can obtain stress by least-square method. The intensity can be used to ‘estimate’ the size (or height) of the diffraction peaks.
- Monte Carlo experiments for uncertainty estimation
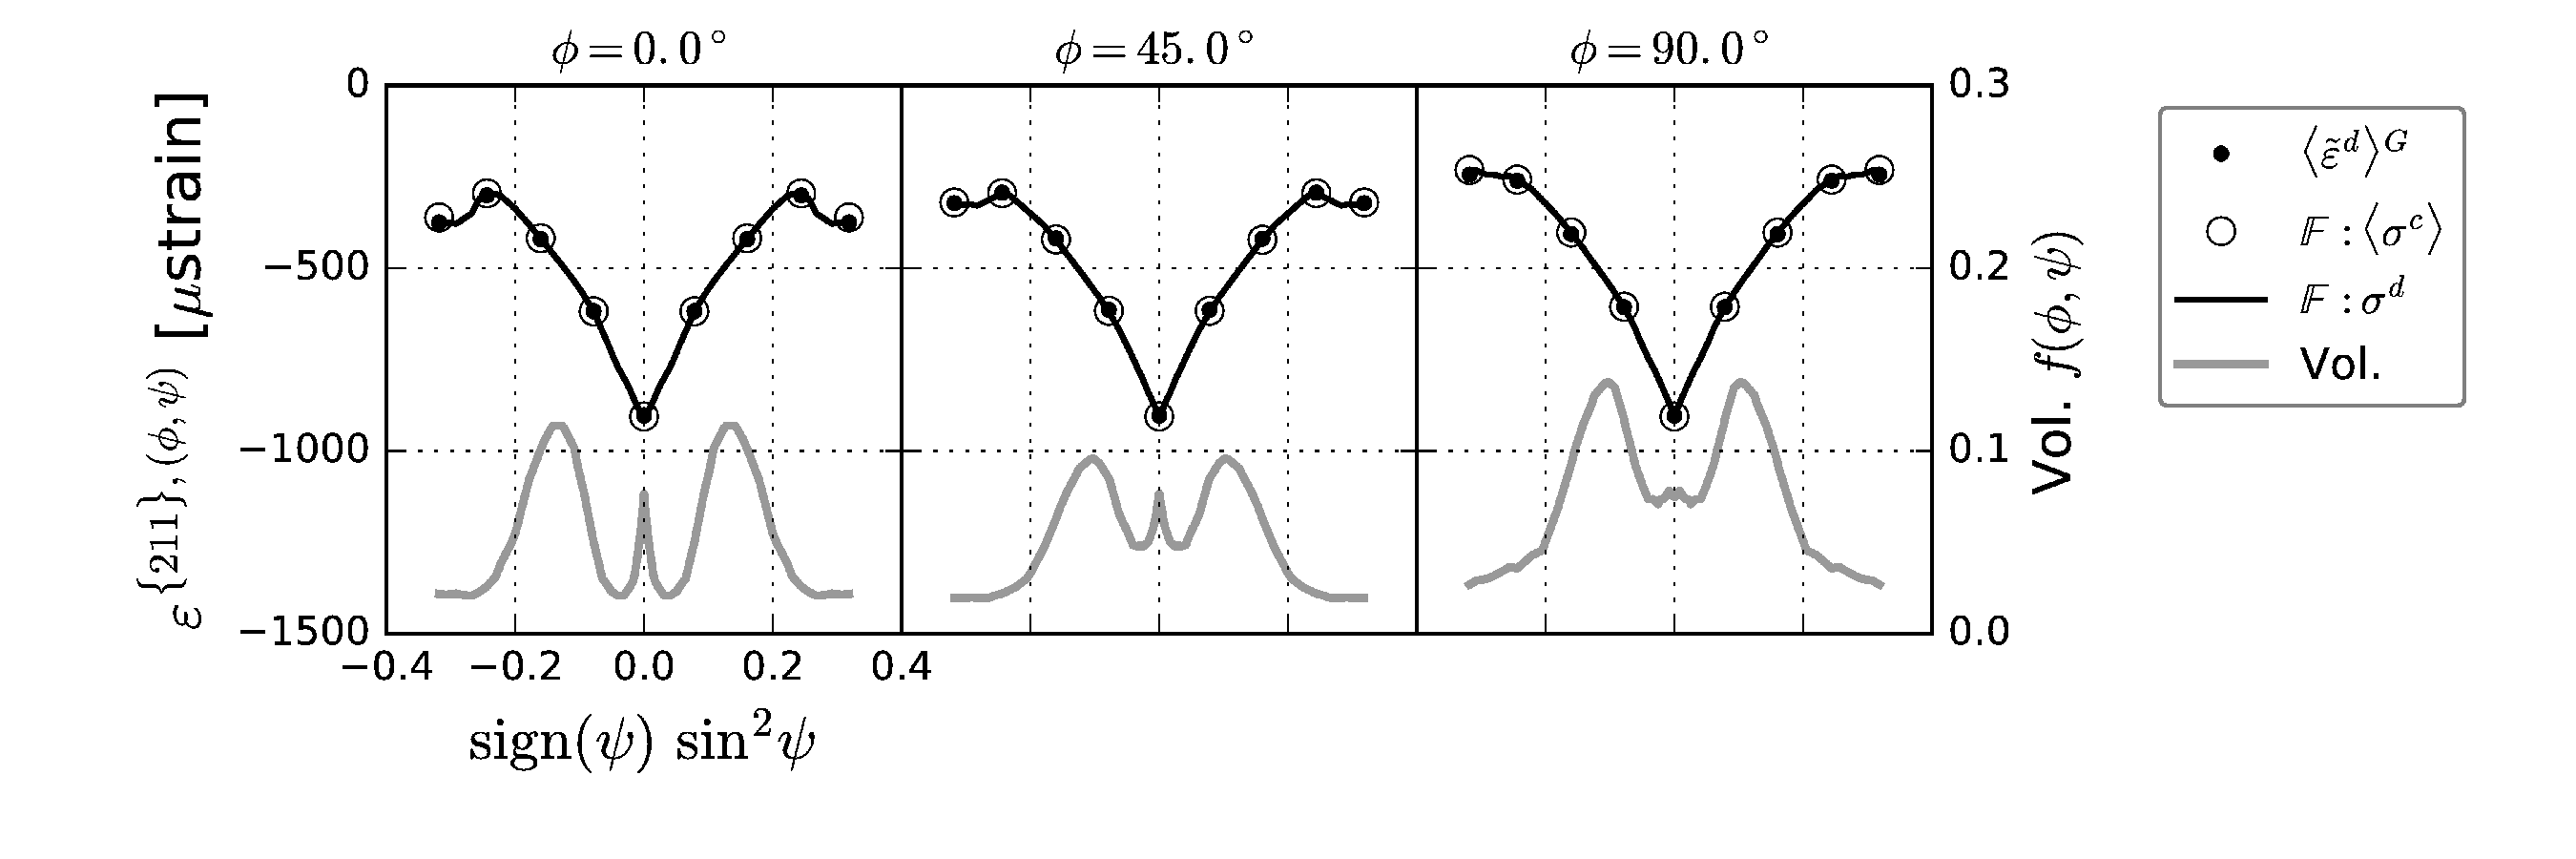
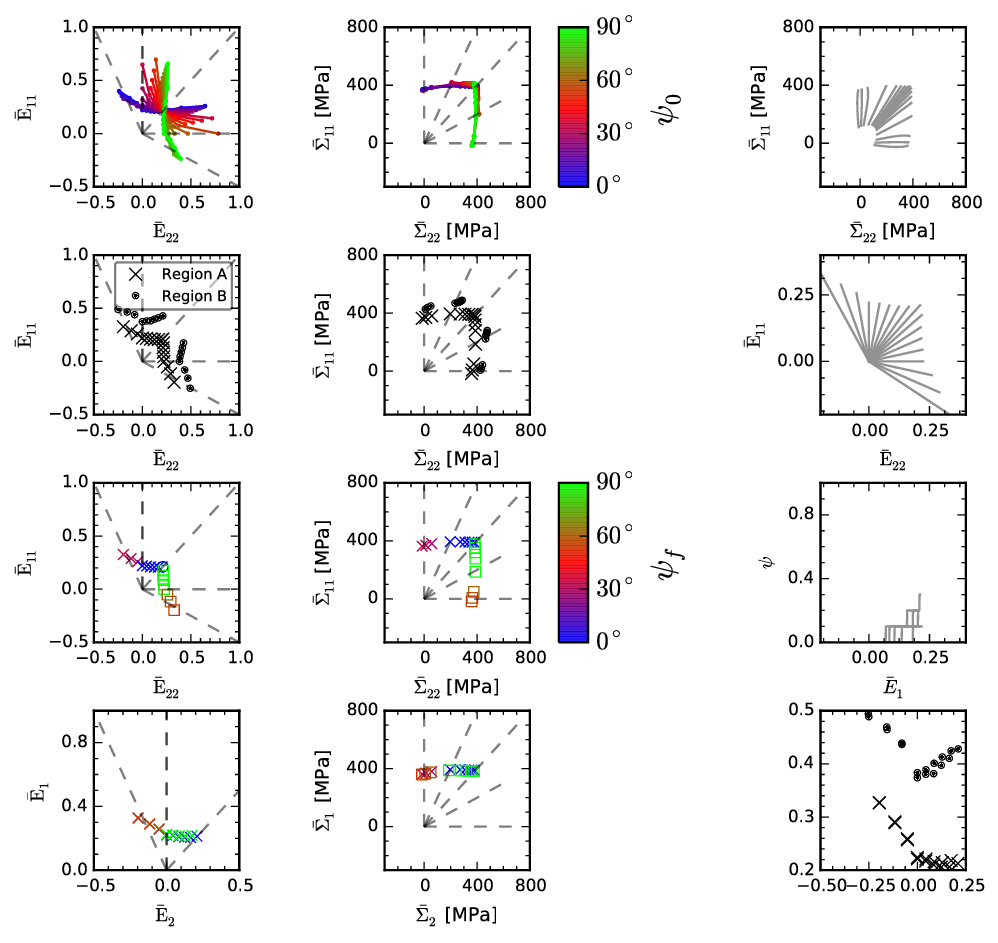
DiffStress comes with a feature that allows the Monte Carlo experiment to quantify uncertainties present in flow-stress measurement technique using in-situ diffraction experiments. Below image shows the resulting internal elastic strain (that is corresponding to d-spacing vs. sin2psi curve in a real in-situ diffraction experiment) and the fitting result (like the conventional sin2psi method widely used in the community of residual stress measurement).
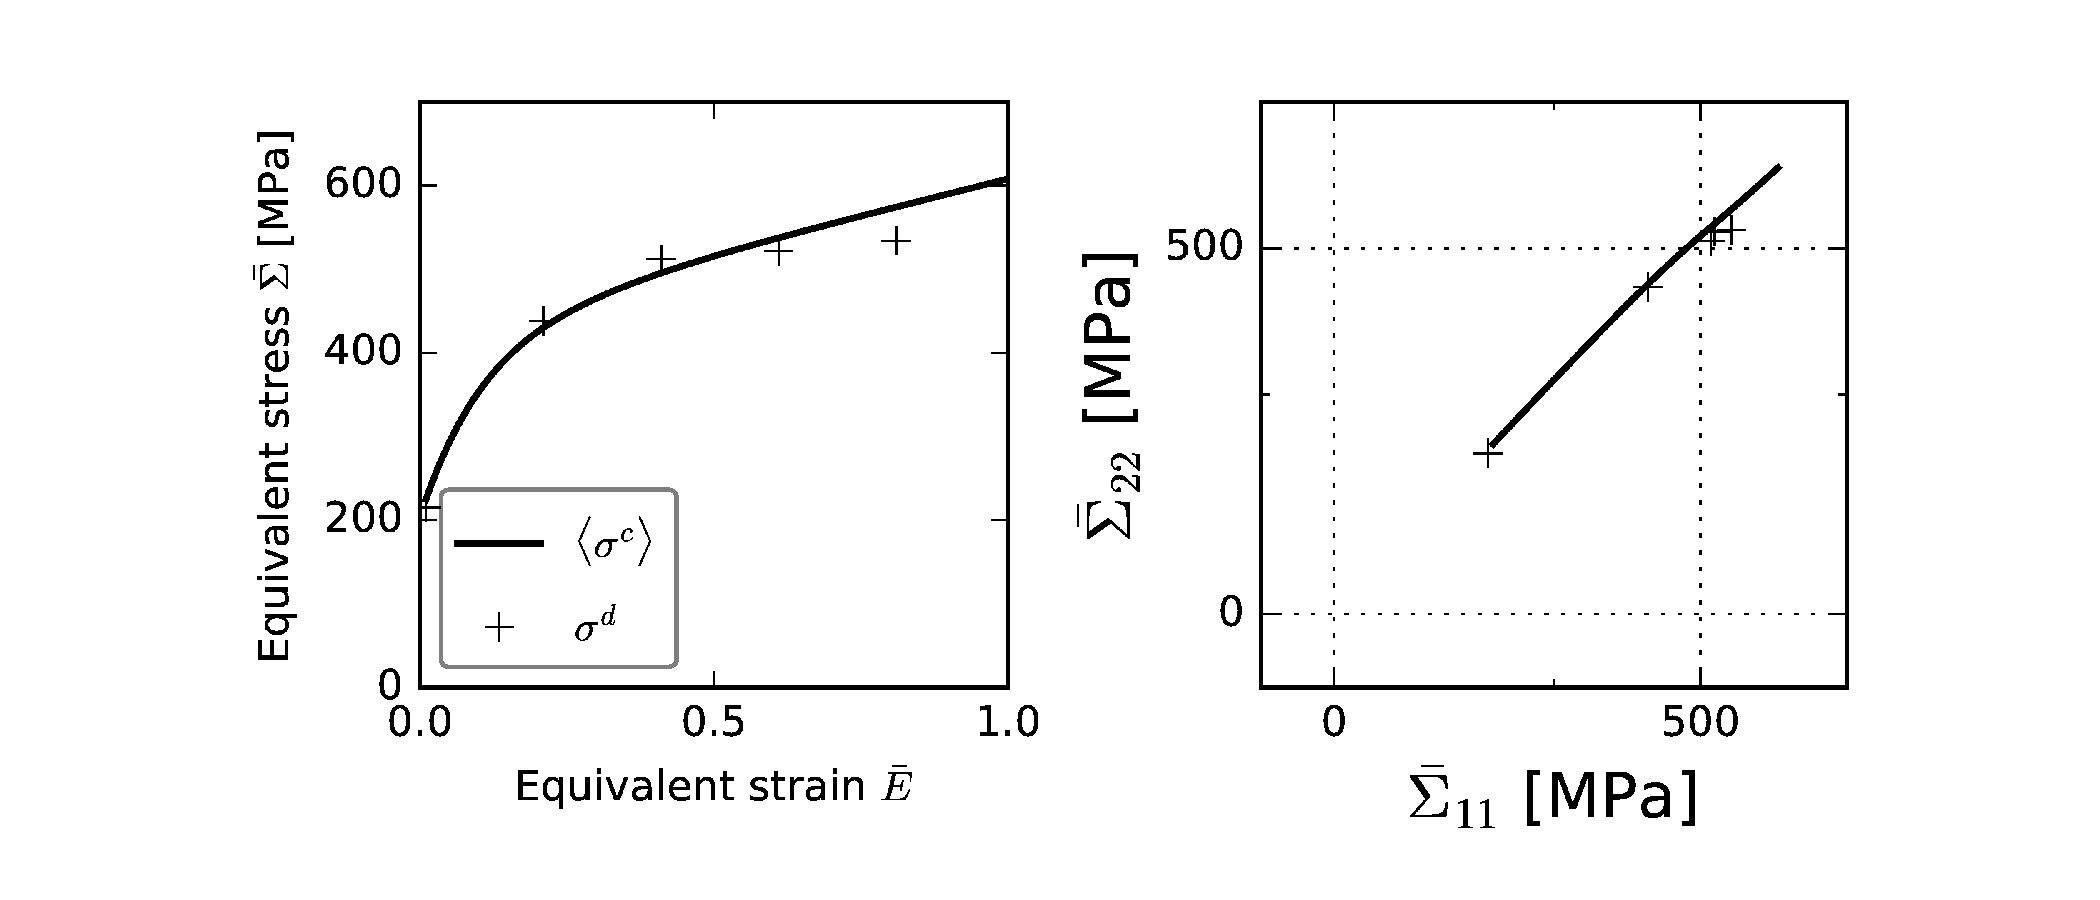
The stress measurement using the internal elastic strain (d-spacing) should lead to a self-consistent result such that the weighted average of stress (the macro stress) is equivalent to the stress measured by this virtual diffraction experiment. Below figure shows that the two flow stress curves (one with weighted average stress another obtained by this virtual diffraction experiment) are equivalent.

In the real experiments, however, this self-consistency may be challenged by various factors. For example, due to the counting statistical nature and a finite period of exposure time in use when determining the peak position (thus d-spacings), the d-spacing obtained by a diffraction peak may contain a degree of uncertainty. Also, the peak height (the total counts collected at a particular orientation) is influenced by the presence of crystallographic (and its evolution w.r.t p lastic deformation) thus further affecting the uncertainty in the measured d-spacing. In DiffStress, one can mimic various types of uncertainties existing in real experiments and can simulate the propagation of these uncertainties to the final stress estimated using the virtual diffraction experiments. The first procedure is to superimpose these uncertainties to the internal-strain used in the virtual diffraction experiment. The internal-strain is then perturbed by counting statistical error, crystallographic texture, and incomplete measurements of diffraction elastic constants, and the finite number of exposure to X-ray beam. By using the perturbed internal strain, the statistical undertainty in the d-spacing measured by diffraction peak can be mimicked. Finally, the difference between the weighted-average stress and the one obtained by the diffraction technique can quantify the propagated error to the stress measured by the diffraction technique.
The below figure show an ensemble, in which the perturbed internal
strain is scattered and deviated from the ‘fitting’.
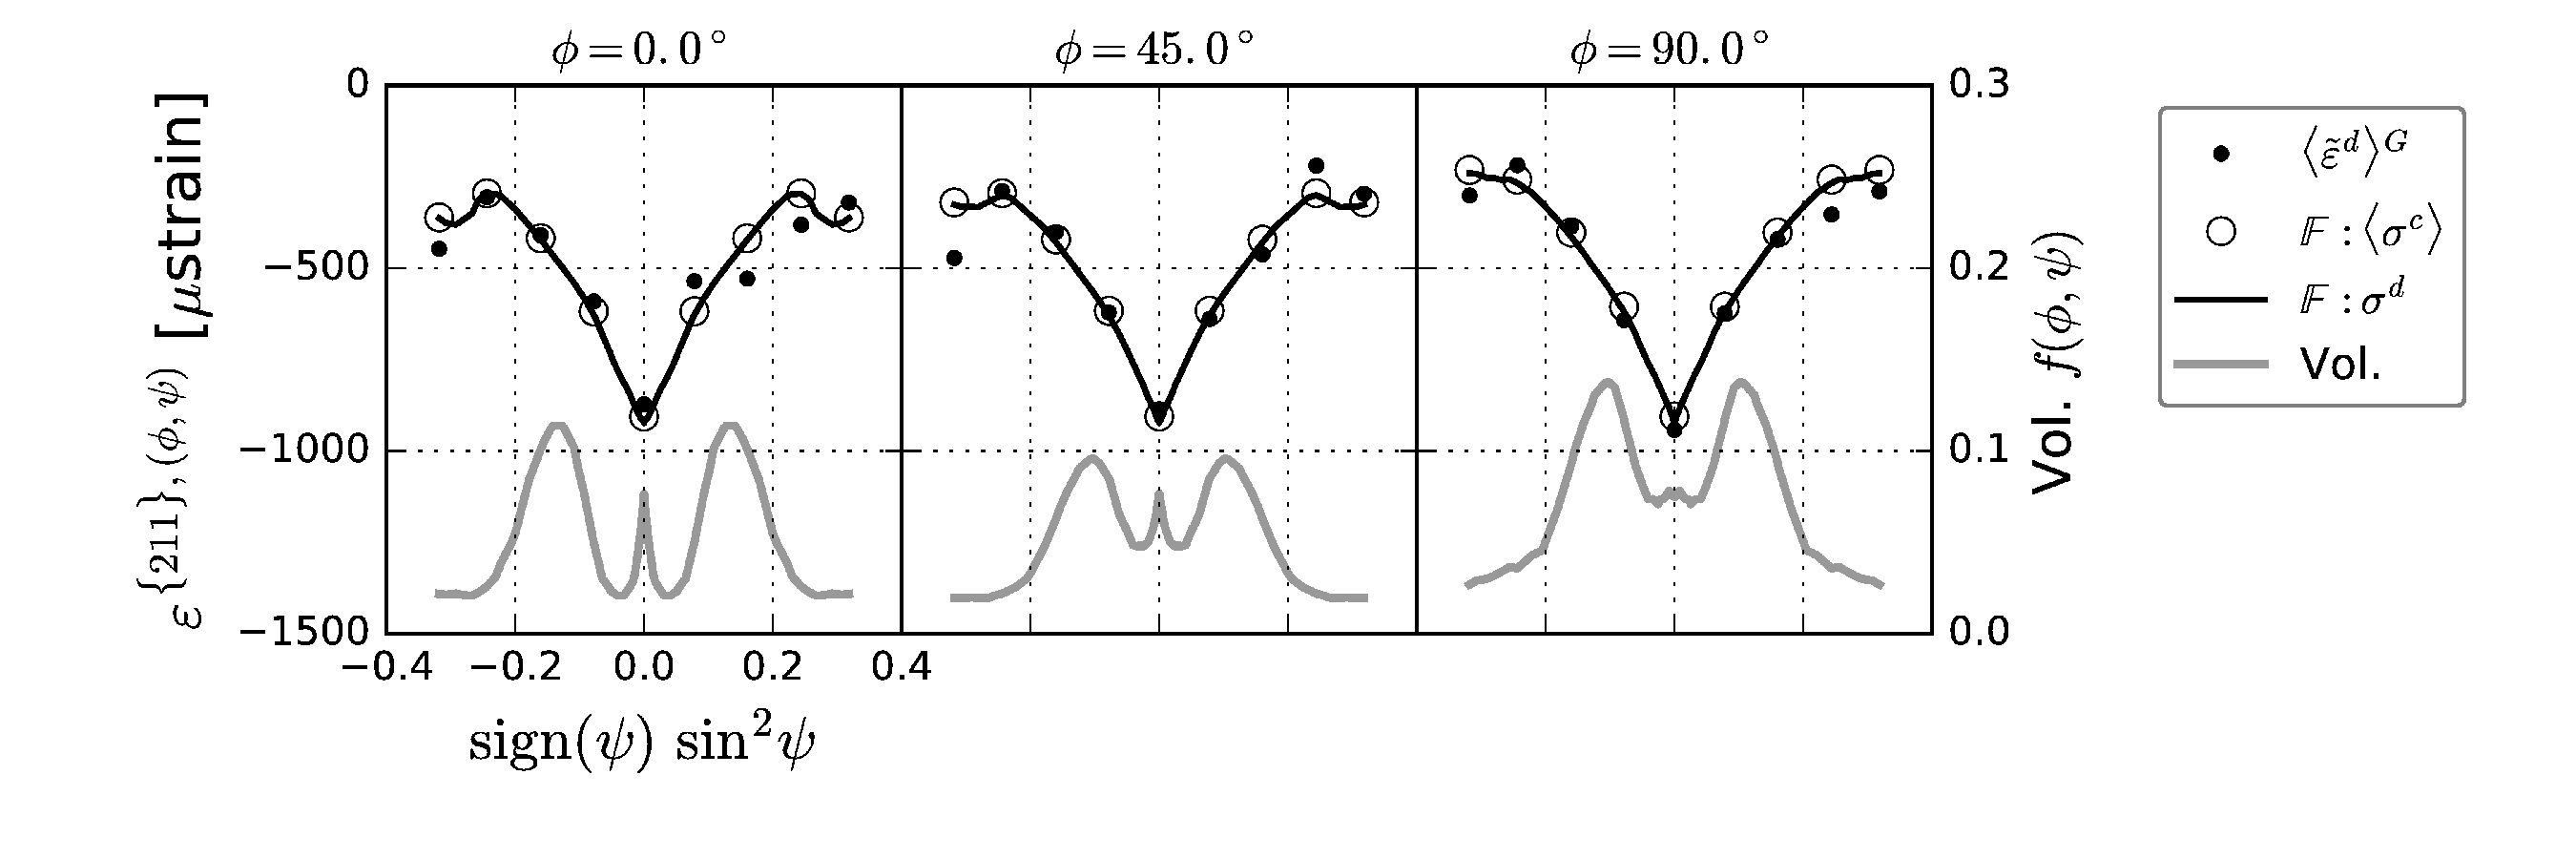
Based on these perturbed internal strain, the stress obtained by the
virtual experiment deviates from the ‘weighted average’ stress as below.
One can repeatedly conduct these virtual diffraction experiments to quantify a statistically meaningful uncertainty, which is very difficult to obtain in real experiments.
This software has been used for the following publications
==========================================================
-
Y Jeong, T Gnaeupel-Herold, M Iadicola, A Creuziger, Uncertainty in flow stress measurements using X-ray diffraction for sheet metals subjected to large plastic deformations Journal of Applied Crystallography 49 (2016)
-
Y. Jeong, T. Gnaeupel-Herold, M. Iadicola, A. Creuziger, Multiaxial constitutive behavior of an interstitial-free steel: measurements through X-ray and digital image correlation Acta Materialia 112 p84-93 (2016)
-
Y Jeong, T Gnaeupel-Herold, F Barlat, M Iadicola, A Creuziger, M-G Lee Evaluation of biaxial flow stress based on Elasto-Viscoplastic Self-Consistent analysis of X-ray Diffraction Measurements, International Journal of Plasticity 66 p103-118 (2015)
VPSC-FLD-YLD
- This package can be used to conduct the below tasks:
- Prediction of Forming Limit Diagram
- Allows the multi-threaded parallel run for fast calculation
- Data analysis and archive the simulation case is scripted which runs as part of core calculation
- Characterization of Anisotropic Yield Functions
- Virtual mechanical tests using user texture and single crystal constitutive description
- Multi-threaded runs for various cases for fast calculation
- Conduct virtual mechanical tests under complex loading path scenarios to obtain parameters for macro-mechanical constitutive description developed for springback
Overview
VPSC-FLD-YLD is a numerical tool developed to predict forming limits and to characterize anisotropic yield surface of polycrystalline metal sheets on the basis of Visco-Plastic Self-Consistent crystal plasticity. This repository is to track the development of VPSC-FLD-YLD code and is a collection of related Python scripts and a modified version of VPSC7b/VPSC7c code written in Fortran.
DEPENDENTS
#This package is dependent on following packages
- texture (pole figure plotting software purely written in python with NumPy, Matplotlib dependency)
- mpl (personal library that decorates and assist data visualization features in VPSC-FLD-YLD)
- One would need fortran compiler (default: gfortran) to compile VPSC source code
- Python scripts in VPSC-FLD-YLD are compatible with Python 2
- Various Linux (Unix) programs such as ‘tar, tail’ …
- Various scientific Python packages - one may install conda/anaconda Python
- LaTeX (optional) - the manual is written in LaTeX
- gnuplot (optional) to allow text-based real-time FLD plots
FEATURES
- FLD calculation using the micro-mechanical descriptions as employed in
the original VPSC7b(7d) code (Ref. [3,7]).
An FLD prediction example can be found in the below figures:
- Link with anisotropic yield function (VPSC-YLD) One can charcterize anisotropic yield function (e.g., yld2000-2d) through virtual tests Various examples are included
- Various types of polycrystal yield surfaces using different amount of offset strains
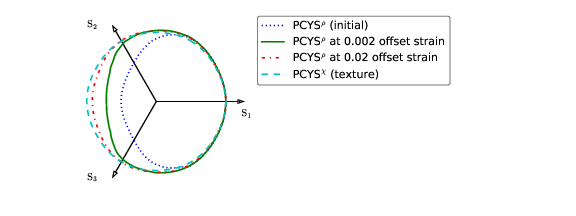
- Subsequent evolution of polycrystalline yield surface by sequential uniaxial tension tests along RD, TD and again RD.
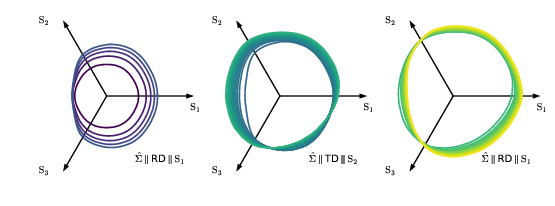
- Polycrystalline backstress can be mapped to the macro-scopic stress space as well
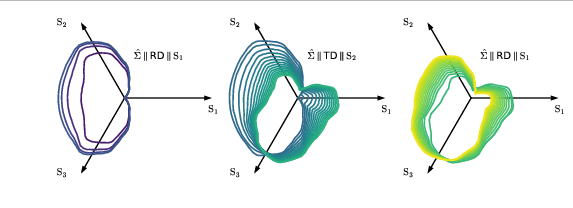
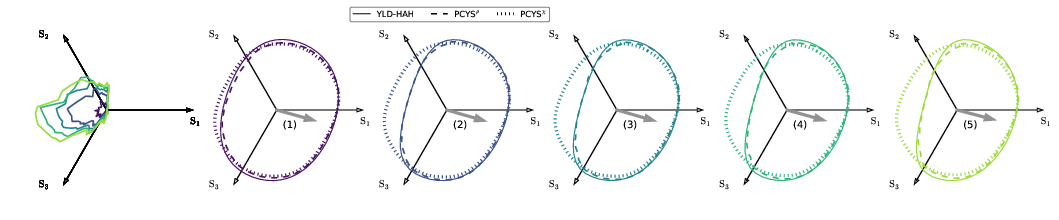
- Modules that can characterize state variables for the homogeneous anisotropic hardening (HAH) model.
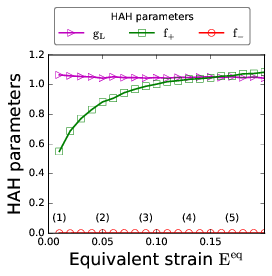
- Characterize homogeneous anisotropic hardening parameters. The homogeneous anisotropic hardening (HAH) parameters can be obtained through virtual experiments using the crystallographic RGVB model that account for dislocation-density based hardening (Ref. [1,2,4])
- Through virtual experiments using VPSC-RGVB, one directly compare with distortional yield surface evolution by HAH approach
REFERENCES (This software has been used in below)
=======================================================
-
Y. Jeong, F. Barlat, C. Tome, W. Wen A comparative study between micro- and macro-mechanical constitutive models developed for complex loading scenarios, International Journal of Plasticity Vol. 93 p212-228, 2017
-
F. Barlat, Y. Jeong, J. Ha, C. Tome, M-G. Lee, W. Wen Advances in Constitutive Modelling of Plasticity for forming Applications, Key Engineering Materials Vol. 725 p3-14 2017
-
Y. Jeong, M-S. Pham, M. Iadicola, A. Creuziger, T. Foecke Forming limit predictions using a self-consistent crystal plasticity framework: a case study for body-centered cubic materials Modelling and Simulation in Materials Science and Engineering 24 (5), 2016
-
Y. Jeong, F. Barlat, C. Tome, W. Wen Validation of Homogeneous Anisotropic Hardening Approach Based on Crystal Plasticity, AIP Conference Proceedings Vol. 1769 160001 2016
-
Y. Jeong, T. Gnaeupel-Herold, M. Iadicola, A. Creuziger Multiaxial constitutive behavior of an interstitial-free steel: measurements through X-ray and digital image correlation, Acta Materialia Vol. 112 p84-93 (2016)
-
Dirk Steglich, Y. Jeong Texture-based forming limit prediction for Mg sheet alloys ZE10 and AZ31, International Journal of Mechanical Sciences Vol. 117 p102-114 (2016)
-
Y. Jeong, M-S. Pham, M. Iadicola, A. Creuziger, Forming limit diagram predictions using a self-consistent crystal plasticity model: a parametric study, Key Engineering Materials Vol. 651 p193-198, 2015
Texture
A collection of python modules to analyze/plot crystallographic texture. Below is the list of main modules included in this package, which can be useful for those who study crystallographic texture / crystal plasticity and those who need to repeatedly plot/visualize the crystallographic data. Also a few modules can be used to generate ideal model textures.
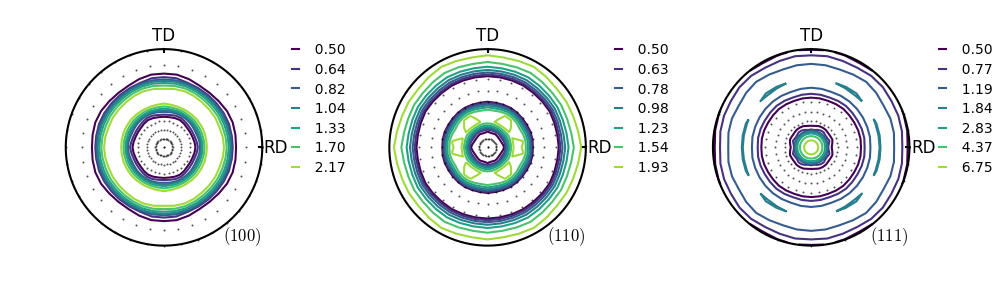
- upf.py
This module can plot pole figures in any crystallographic structure from a discrete set of orientations.
Look at the examples in ./ipynb/ folder.
One can plot pretty pole figure plots and have a lot of options.
(see also some example pole figures generated by this module in below)
Compatible formats are:
- EPF (experimental pole figure formats used in popLA)
- VPSC texture (the collection of discrete orientations used in VPSC,EVPSC)
- Bruker’s *.uxd file
- bcc_rolling_fiber.py This module generates a set of ‘ideal’ fiber textures including ‘gamma’,’alpha’,’eta’,’epsilon’ and ‘sigma’. This module was used to create the set of BCC fibers studied in the paper entiled “Forming limit prediction using a self-consistent crystal plasticity framework: a case study for BCC fiber textures” submitted to Modelling and Simulations in Materials Science and Engineering.
- hcp_fiber.py A set of model basal-pole fibers for AZ31/ZE10 magnesium alloys. This module has been used in a paper under preparation, that is entitled “Texture-based forming limit prediction for Mg sheet alloys ZE10 and AZ31”.
- cmb.py A tool to sample discrete orientation files from a discretly sampled COD in the Euler space. One can use this to extract the arbitrary number of discrete orientations from COD files generated by popLA.
- cod_section.py A tool to visualize cod sections from directe orientation files
Features
Plot beautiful pole figures from a population of discrete orientations (such as the texture input to VPSC code).
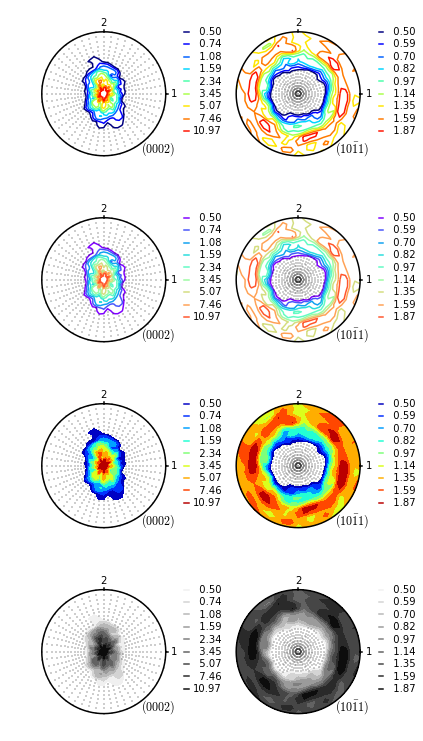
Experimental pole figures can be also drawn using exactly the same template. The below example shows the case for the EPF format (a.k.a. the popLA format).
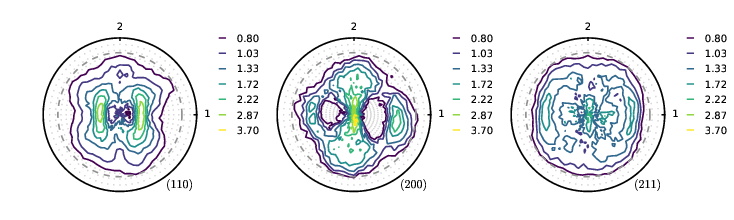
One can generate model textures typically found in rolled sheets. For example, a gamma fiber typically found in various mild steel sheets can be easily created.
Installation
Following installation guide has been checked for Mac and Linux machines. For Windows, I have not thoroughly checked but the same method should be applicable.
What you first need is Python and scientific python packages including NumPy, SciPy, Matplotlib. I recommend the use of Anaconda, which will install all of these packages easily. You’ll need a fortran compiler as well - I use gfortran.
You can simply clone this repository to your local filesystem. I usually use ‘set.sh’ to install. But one can also do followings
python setup.py build
python setup.py install --user
After a successful installation, consider testing pole-figure plotting feature. In the prompt, enter IPython interpreter.
ipython --pylab
In IPython, you can test if you can draw (100) and (110) pole figures of a texture consisting of 1000 random grains as below.
If you have a texture file in the format compatible with VPSC, you can give a specific filename
One can draw experimental incomplete pole figures as well.
Data and pole figures generated by this module have been used in the following publications
- Texture-based forming limit prediction for Mg sheet alloys ZE10 and AZ31, Dirk Steglich, Youngung Jeong, International Journal of Mechanical Sciences 117, p102-114 (2016)
- A comparative study between micro- and macro-mechanical constitutive models developed for complex loading scenarios, Y. Jeong, F. Barlat, C. Tome, W. Wen, International Journal of Plasticity (In press)
- Forming limit prediction using a self-consistent crystal plasticity framework: a case study for BCC fiber textures, Y. Jeong, M.-S. Pham, M. Iadicola, A. Creuziger, T. Foecke, Modelling and Simulation in Materials Science and Engineering 24 (5), 055002 (21 pp)
License
This software was written by Youngung Jeong and it started in 2011 while he was a student at POSTECH, South Korea. TEXTURE is a collection of personal libraries used to study crystallographic texture. You are permitted to redistribute the source code (and binaries). This software is distributed in the hope that it will be useful but without any warranty.